![Rapid [logo]](/themes/rapid-NOC8X/logo.svg)
Integrated Transports & Overturning Streamfunction
Timeseries
Monthly transport timeseries are available in RAPID_transports_v2024-2.nc and RAPID_layers_v2024-2.nc (NetCDF format) from April 2004 to November 2024.
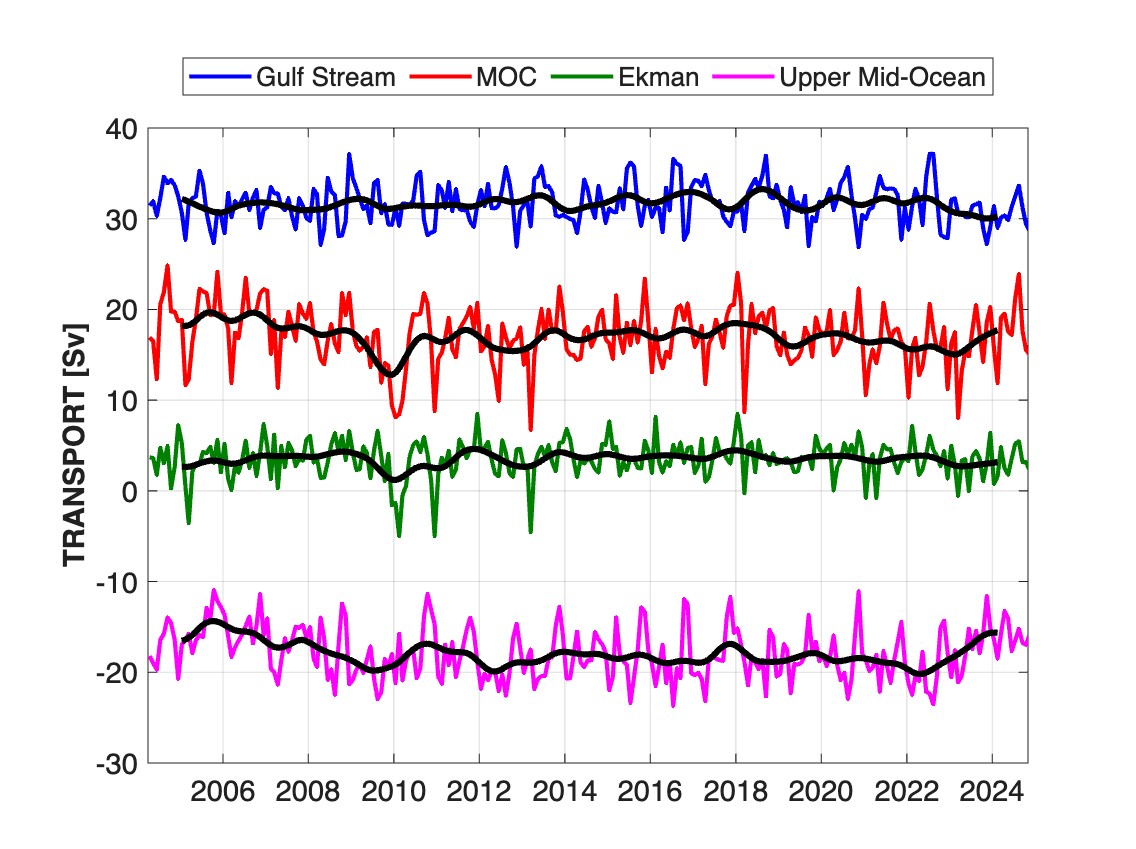 |
Figure 1: Monthly (colours) and 18-month (black) low-pass filtered timeseries of Florida Straits transport (blue), Ekman transport (green), upper mid-ocean transport (magenta), and overturning transport (red) for the period April 2004 to November 2024. Florida Straits transport is mainly based on electromagnetic cable measurements; Ekman transport is based on ERA5 wind stress. The upper mid-ocean transport, based on the RAPID mooring data, is computed as the sum of interior and WBW transport integrated from the surface down to the depth of the streamfunction maximum. Overturning transport is then the sum of the Florida Straits, Ekman, and upper mid-ocean transports and represents the maximum northward transport of upper-layer waters on each time step. Positive transports correspond to northward flow. Statistics for these timeseries are Mean±SD : Gulf Stream 31.7±2.2 Sv; Ekman 3.5±2.0 Sv; Upper mid-ocean -17.9±2.8 Sv; MOC : 17.1±3.2 Sv. |
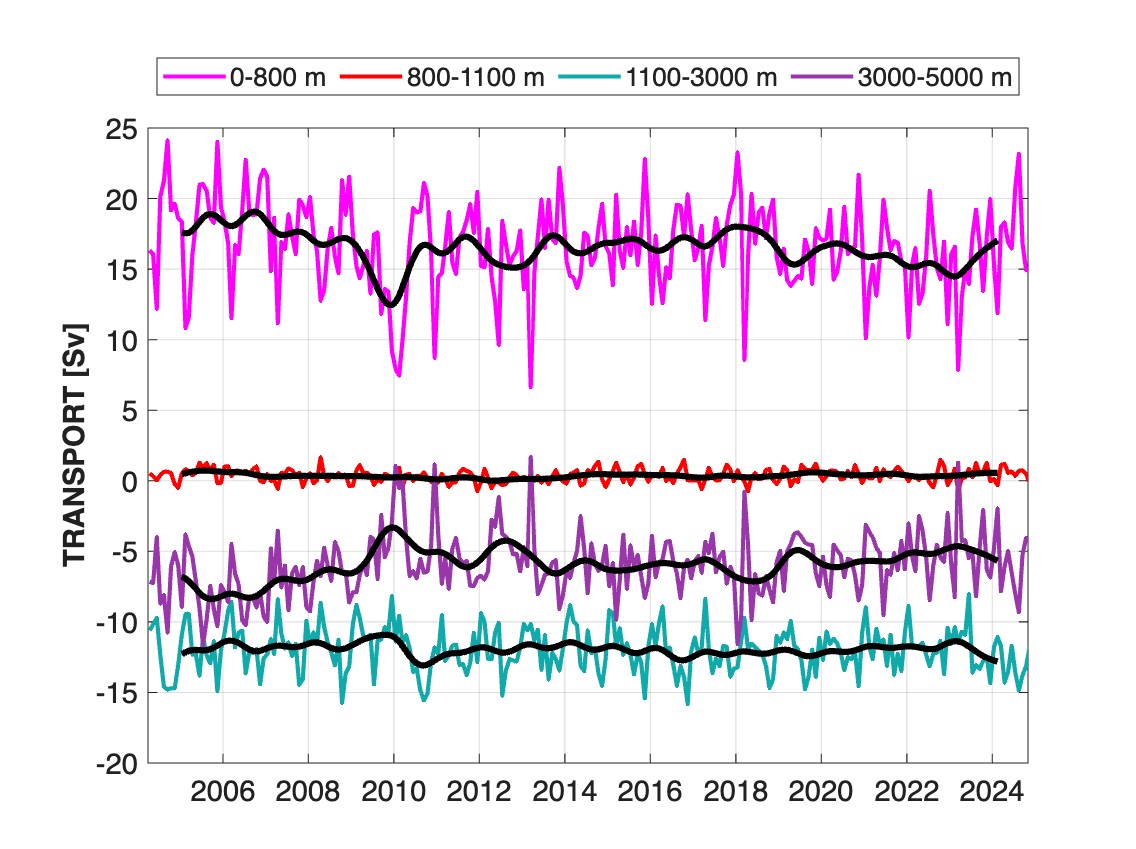 |
Figure 2: Layer transports in the depth range (magenta) 0 to 800m for Surface Water, (red) 800 to 1100m for Intermediate Water, (turquoise) 1100 to 3000m for Upper North Atlantic Deep Water, and (purple) 3000 to 5000m for Lower North Atlantic Deep Water. Note that the thermocline transport in this release (v2024-2) includes the Florida Straits transport, so that the thermocline recirculation southward can be obtained by subtracting the Florida Straits transport. The sum of the Upper and Lower North Atlantic Deep Water Transports is the lower limb of the overturning. Negative transports correspond to southward flow. Statistics for these timeseries are Mean±SD : SW 16.6±3.1 Sv; IW 0.4±0.5 Sv; UNADW -12.0±1.6 Sv; LNADW -5.9±2.2 Sv. |
Overturning streamfunctionMonthly overturning streamfunction from April 2004 to November 2024. The streamfunction is the integral of the meridional transport from the surface to the given depth. The MOC is defined as the maximum of the streamfunction. Usually the maximum is found at a depth close to 1100m. |
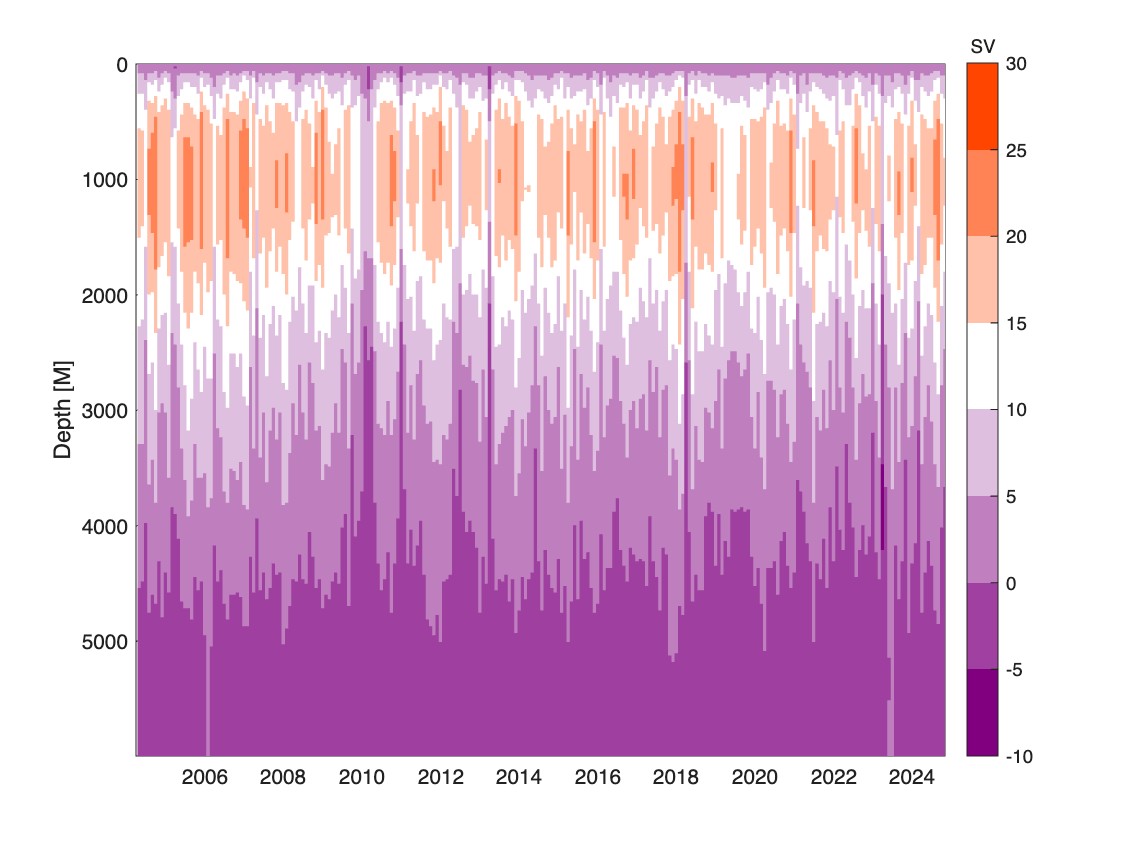 |
Figure 3: Vertical MOC structure from April 2004 to November 2024. |