


The RAPID Challenge Blog
Reports from the RRS Discovery.
How some of the predictions were made.
AMOC time-series with predictions Larger
Self-logging ADCP MORE

New sensors this year MORE
Biogeochemical sensors MORE
RAPID Challenge 2015: Announcing the winners
The Atlantic Meridional Overturning Circulation (AMOC) transports heat northwards in the Atlantic, and gives Western Europe its moderate climate. Without it, our winters would be colder than they are.
In October - November 2015 the RAPID team collected the most recent data from their array of moorings across the Atlantic at 26°N Before this they issued a challenge to the climate and ocean science community: can you predict what the new data will show?
Competition results
Ten scientists ventured to predict the AMOC in the RAPID challenge competition. The preliminary analysis of the data has been completed, and it is time to announce the 'best prediction'.
But how do we quantify the best prediction? And do any of these predictions have useful forecast skill?
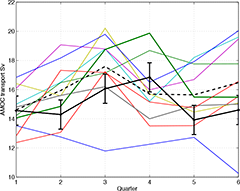
Competitors were asked to estimate what the mean AMOC would be in each of 6 quarters starting with April to june 2016 and finishing with July to September 2015. The ten entries and the AMOC calculated from a preliminary analysis of the new data is plotted on the right.
During this period the mean of preliminary analysis gives a mean AMOC of 15.05 Sv with a standard deviation of 1.04 Sv. This standard deviation is less than half that of the preceding three years, indicating that the AMOC has been relatively stable during the last 18 months.
How skilled were the predictions?
Common measures of skill compare the forecast errors with the variability of the data. So based on the variability of the data an accuracy of 1Sv seems a good benchmark. Another useful benchmark is a prediction based on persistence, i.e. the last measured value. The absolute error of persistence was below 1Sv for the first three quarters but rose after that.
Four of the ten entries had an error less than 1Sv for the first quarter and each of these was also better than persistence. These results suggest a significant amount of skill when predicting three-months ahead, and the mean of all the predictions was almost spot on the value of the data with an error of just 0.05 Sv. In the second quarter things were very different. Only one prediction bettered persistence.
None of the competition entries had absolute errors of less than 1Sv for all of the first three quarters. Over the full 6 quarters the root mean square error (RMSE) of the entries ranged from 1.4Sv to 3.7Sv.
Joint winners
The lowest RMSE was the prediction of Leon Hermanson from the UK Met Office. The only prediction to have skill in both of the first two quarters was the entry by Daniela Matei and Helmuth Haak from the Max Planck Institute. These two entries are declared to be joint winners and will each receive a Discovery mug. Congratulations!
Clear need for continued observations
None of these hind casts showing skill beyond 6 months, and a prediction based on persistence (perhaps by chance) beat all of them. Thus the need for observations is clear, and the RAPID team will next be going to sea in Spring 2017 to retrieve the next measurements of the AMOC.
The small print: The results are only provisional. Full calibration and quality control of the data have not yet been completed. The calculation of the transport in the Western Boundary Wedge has not been completed and we have used the average value of preceding years for this component.
How the predictions were made
Some of the teams published their predictions in more detail. To see short summaries of their methods follow the links below:
-
What will the RAPID team find when they recover their ocean moorings this autumn?
(Helen Johnson, David Marshall, Helen Pillar and So Takao, University of Oxford) -
Predicting what the RAPID team will find using an ocean analysis
(Laura Jackson, Chris Roberts and Drew Peterson, Met Office) -
Will the RAPID team find more large amplitude overturning excursions?
(Grant Bigg, Jose Roberto Ayala Solares and Hua-Liang Wei, University of Sheffield) -
A statistical time series approach to predicting the AMOC
(Peter Challenor and students on the 'Statistical Modelling in Space and Time' 4th year mathematics module, University of Exeter) -
Near-real time estimates of the AMOC using altimetry
(Eleanor Frajka-Williams, University of Southampton) -
Predicting the next 18 months of the AMOC at the RAPID line with a statistical model
(Nick Foucal, Duke University)
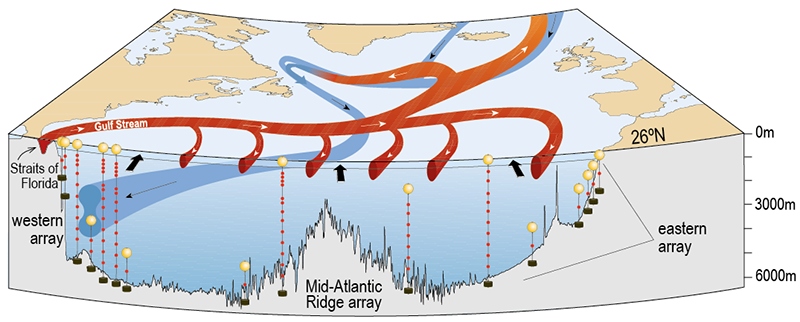
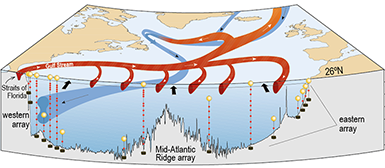
Schematic of the Atlantic meridional overturning circulation with the RAPID moorings. Credit: NOC
The RAPID array at 26° North
The RAPID array consists of:
- the Western Boundary array: several moorings running down the continental slope off the coast of Florida
- the Mid-Atlantic Ridge array: moorings on the east and west side of the Mid-Atlantic Ridge, and
- the Eastern Boundary array: several shorter moorings running down the continental slope of the coast of Morocco.
- Cable measurements in the Florida Channel complement the moorings, and complete the measurements needed to calculate the AMOC and its components.
The moorings measure temperature, salininity and ocean currents at several depths. The tallest mooring is over 5km high.
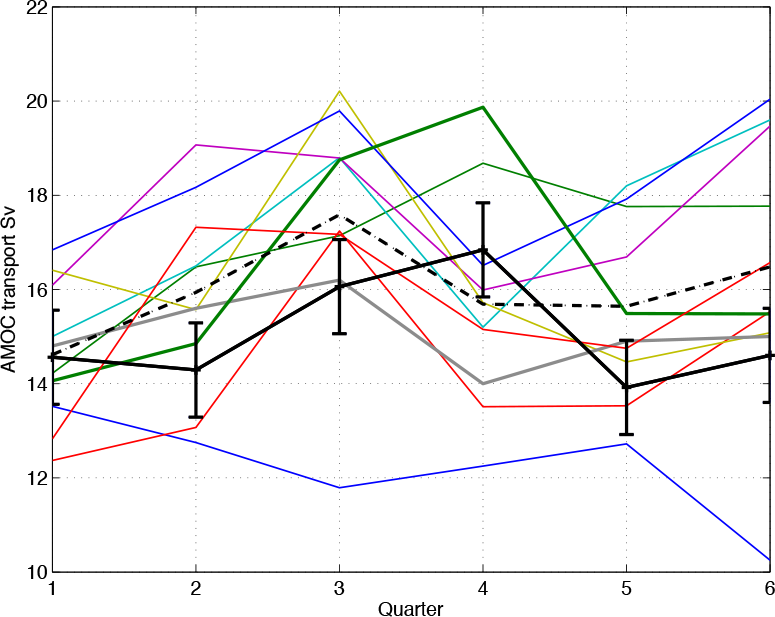
The thick black line shows the provisional RAPID data and the vertical bars are +/- 1 Sv. The thick dashed line shows the mean of all the entries. Coloured lines show the individual entries. Of these the two best estimates are highlighted with thick lines. Green being MPI and grey is the Met Office.
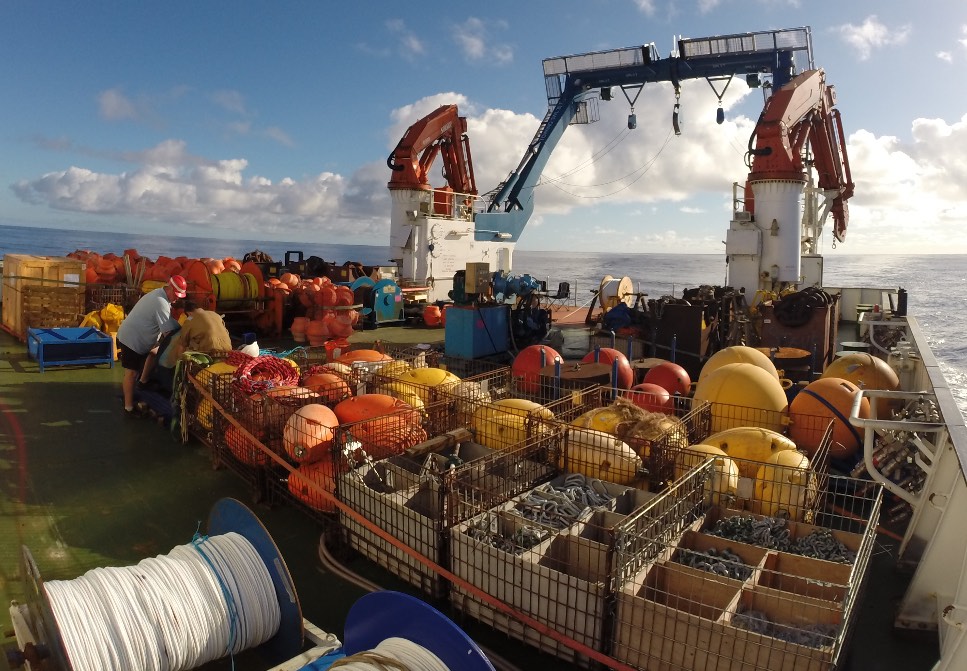
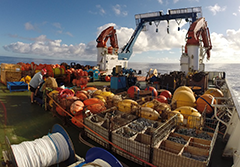
Aft deck of Discovery with the moorings ready for deployment in November 2015. Photo: Gerard McCarthy.
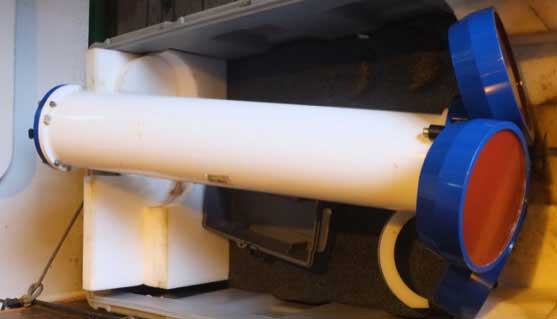
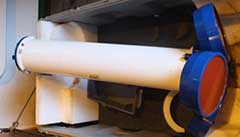
A self logging version of an Acoustic Doppler Current Profiler (ADCP) being prepared for deployment before being mounted in a float. Photo: Darren Rayner.
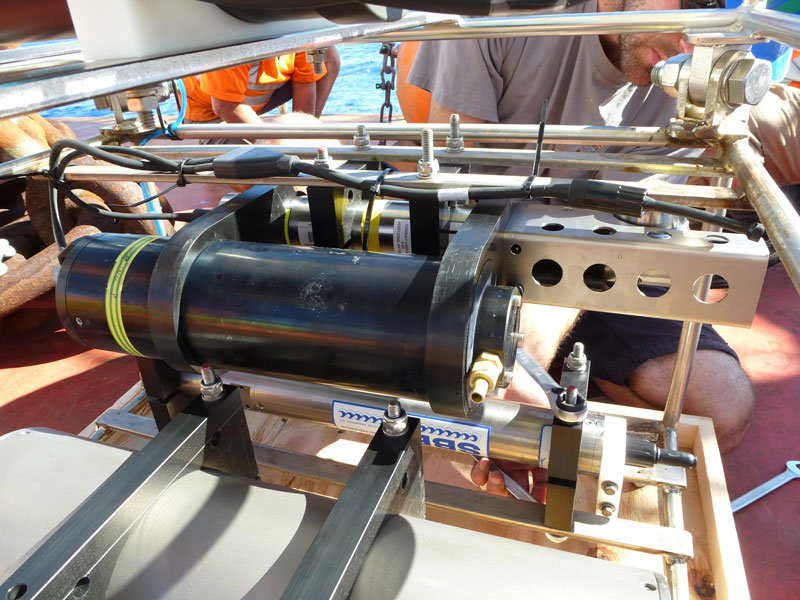
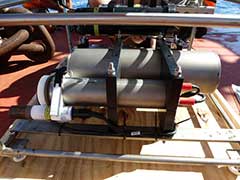
The ABC project is adding biogeochemical sensors to the RAPID moorings for the first time. The photo shows part of the ABC sensor suite: pH sensor (black cylinder, foreground), temperature, salinity, pressure and oxygen sensor (silver cylinder with circular-holed guard, centre-ground), temperature/salinity/pressure sensor (below).
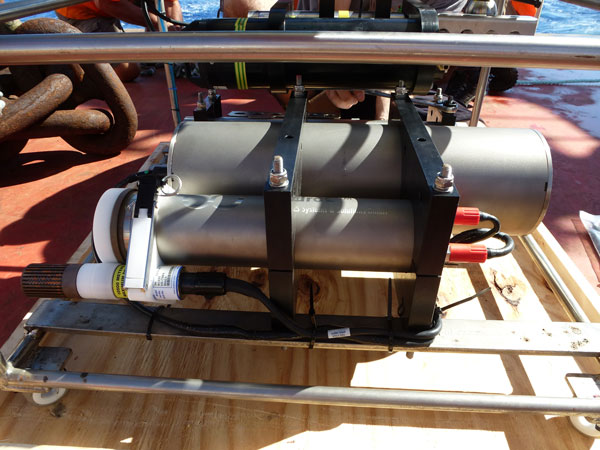
Other part of the ABC sensor suite: Baby Bear (pump), Mummy Bear (pCO2 sensor), Daddy Bear (battery pack)