

Scientific background
The Atlantic Meridional Overturning Circulation (AMOC) plays an important role in Earth's climate system. It transports heat from the tropical Atlantic to higher latitudes and helps to give Western Europe its mild winter climate.
This system of surface and deep currents has been of interest to oceanographers and climate scientists for decades. In 2004 it became more widely known.
The fear of rapid climate change
Two events in 2004 brought the concept of "rapid climate change" to public attention. The first was a report for the Pentagon on the implication of "abrupt climate change" for U.S. national security. The second was the film "The Day after Tomorrow" - a disaster movie that depicted the sudden advance of a second ice age as the AMOC stopped and the "great ocean conveyor" ground to a halt.
That same year, 2004, also saw the first deployment of an array of moorings across the Atlantic from Florida to Morocco (figure 3). This was the start of the RAPID observations. The observing system has now completed over a decade of continuous AMOC measurements. These observations and the associated research projects have yielded surprising results and revolutionised our understanding of the AMOC.
A brief overview of the AMOC
The main charcteristics of the AMOC are a northward flow of warm water in the surface ocean and a cold return flow in the deep ocean. As the warm, salty water flows northward it loses heat to the atmosphere and increases in density. Eventually it becomes dense enough to sink, and flows back southward at depth - mainly in the Deep Western Boundary Current at depths of 3-5000 m. This vertical overturning circulation transports heat from the tropics to the high latitude Atlantic.
Density is defined as mass divided by volume. The density of seawater depends on its temperature and salinity. The saltier the water, the denser it is. When water cools, its volume shrinks and its density increases. In the ocean higher density water will always sink beneath water of a lower density.
The AMOC even transports heat northward across the equator. Maximum northward heat transport in the Atlantic occurs at 24° to 26° North, and is about 1.3 PW, equivalent to twenty-thousand times the peak wintertime power consumption in the UK.
This is about 25% of total (atmosphere and ocean) poleward heat transport at these latitudes, so future changes in the AMOC could have substantial impacts on climate.
Climate simulations carried out before the start of RAPID showed that if the AMOC shut down, winter temperatures in northwest Europe might fall by as much as 4°C over a period of only 10 years. Once past its tipping-point the AMOC might take 100 years or more to recover.
These studies raised some important questions. How likely is it that the AMOC would collapse or slow down as a result of global warming? What effect would a slow-down have on European climate? If a shut-down was about to occur, how much warning would we get ? What measurements could we make to give us time to prepare for a colder North Atlantic climate?
Later studies showed a more moderate, but still important cooling potentially arising from an AMOC slow-down. All the models used in the IPCC's 5th Climate Change Assessment show some degree of AMOC slow-down as a result of global warming.
AMOC slowdown as a result of global warming
Global warming as a trigger for the cooling of Western Europe may seem like a paradox. The explanation lies in the delicate balance of temperature and salinity that controls vertical flow of water in the Atlantic.
When salty Gulf-Stream water cools at high latitudes, it becomes denser than the deep water below and sinks. This formation of North Atlantic Deep Water (NADW) and its return south (figure 4) is one of the 'engines' that drive the AMOC.
If North Atlantic surface water were to become less salty, it may no longer become dense enough to sink, however much it cools. The formation of NADW would stop. So would the ocean's poleward heat transport and the flow of mild Atlantic air across Western Europe, creating a rapid drop in winter temperature.
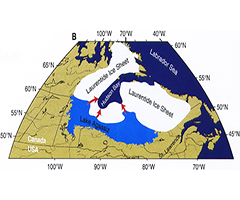
Such falls in temperature have happened in the past as the world came out of the last ice age. The most recent occurred about 8,200 years ago, when melt-water from the Laurentian ice sheet flooded the North Atlantic (figure 6). The event left evidence of widespread cooling of the North Atlantic region, which can be seen in Greenland ice cores, lake and ocean sediments, peat bogs and speleothems. This palaeo-record showed a period of rapid cooling (over 10-20 years) followed by a much slower recovery.
Speleothems are mineral deposits formed from groundwater within underground caverns. Stalagmites, stalactites, and other cave forms may contain annual bands or contain compounds that can be radiometrically dated.
In 2001 the Intergovernmental Panel on Climate Change (IPCC) WorkingGroup 1 concluded in their Third Assessment Report that most models predicted a weakening of the THC over the 21st century. This brought renewed efforts to make observations of the Atlantic Meridional Overturning Circulation (AMOC), and led to the establishment of the RAPID Climate Change Programme (RAPID), which started in 2001 and is now in its third phase.
Since 2004 we have learnt more about AMOC variability, which is much greater than we originally thought. Ten years of RAPID observations have answered some of our questions and yielded inevitable surprises, which in turn raise new questions.
Climate models have increased in complexity and spatial resolution since IPCC's 2001 report. None of the climate models contributing to the IPCC's 5th model intercomparison (CMIP-5) show a shut-down of the AMOC, but most still show a slow-down, which is greater with a faster rate of global warming. What such changes to the AMOC means for regional climate and climate prediction is still a topic of active research.
Whilst the main impact of an AMOC slow-down is likely to be reduced poleward heat transport, there are also other indirect effects on the climate system, for example through potential changes in the ocean's ability to take up and store carbon released to the atmosphere by human activities such as the burning of fossil fuels.
Three phases of RAPID
RAPID (2001-2007)
The first phase of RAPID saw the start of the RAPID array across the Atlantic at 26° N along with another 38 research projects to study the AMOC and its links with climate over the past 8-9000 years, using palaeo- and present-day observations and a range of modelling studies. Highlights from this research can be found in the RAPID climate change brochure.
RAPID-WATCH (2008-2014)
The second phase (RAPID-WATCH) concentrated on observations of the present-day AMOC and modelling studies to explore mechanisms controlling its flow and improve our understanding of how AMOC variability and change affects climate in Europe and elsewhere. This phase completed the decade-long time series of AMOC data from 26°N and explored how these observations might be used with other observing systems to improve our ability to predict AMOC variations and their impact on climate at seasonal to decadal and longer time scales.
RAPID-AMOC (2014-2020)
RAPID is now in its third phase, RAPID-AMOC. This continues the measurements at 26°N until 2020 and extends these to include biological and chemical measurements in order to determine the variability of the AMOC and its links to climate and the ocean carbon sink on interannual-to-decadal time scales. More about research in RAPID-AMOC.
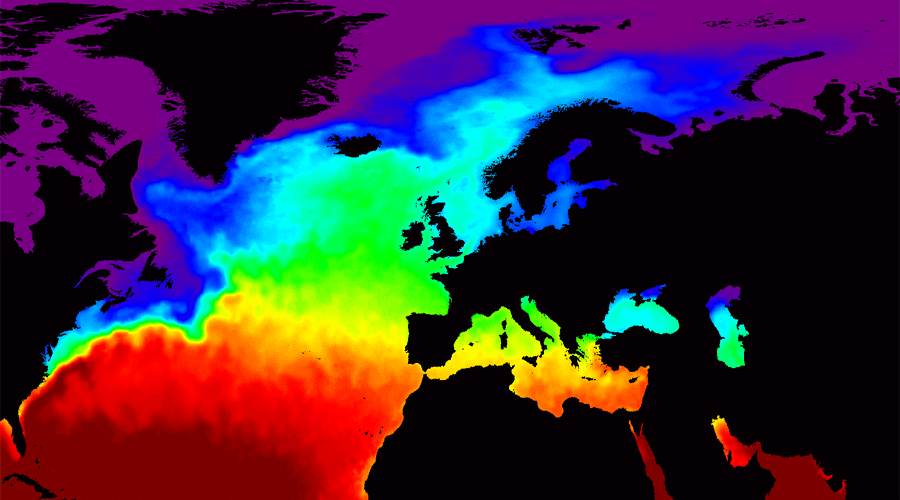
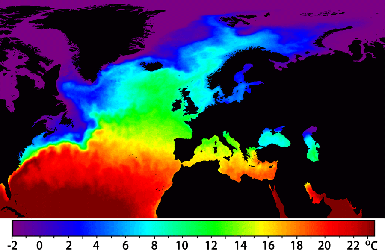
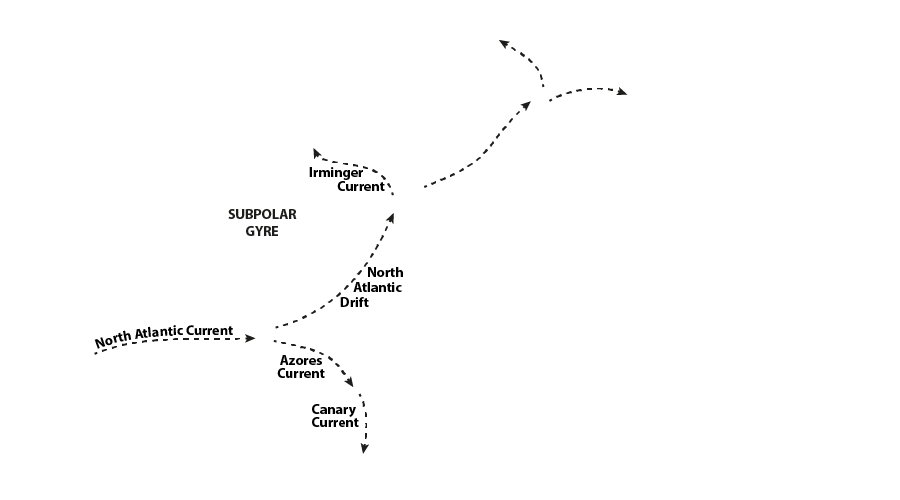
Sea surface temperature from satellites in January 2008. Credit: NOC / Met Office OSTIA.
This image shows clearly how warm water from the Gulf Stream leaves the coast of North America to flow eastwards across
the Atlantic in the North Atlantic Current. Some of the water turns back southward to form the Azores Current and later the Canary Current
- broad, slow eastern boundary currents of the North Atlantic Subtropical gyre.
The rest flows northeastward past Scotland and Norway.
The warm water releases heat to the air above. Prevailing westerly wind at latitudes of 40° to 60° North take the warm Atlantic air to Western Europe. This gives northwest Europe its mild winter climate.
Although the water cools along the way, sufficient heat remains to warm the eastern Barents Sea and the Atlantic sector of the Arctic Ocean. The warm atlantic water is also responsible for keeping the Arctic Russian port of Murmansk ice free in winter, whilst the Baltic port near St. Petersburg is icebound for around a month each winter.


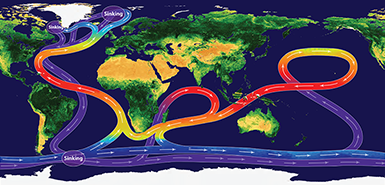
The "great ocean conveyor". Credit: NOC. PDF version available on request
The "great ocean conveyor" received its name because of the way ocean currents transport heat, salt, nutrients, dissolved gases,
and much else around the global ocean.
It links surface and deep currents through cooling and sinking of surface water in the North Atlantic and the Southern Ocean.
Deep water returns to the surface ocean through mixing and upwelling,
but this may take hundreds of years.
The Southern Ocean (around Antarctica) links the Atlantic, Indian and Pacific Ocean. At the surface warm surface water flows from the Pacific to the Indian Ocean through Indonesia, and from the Indian Ocean into the Atlantic as 'Agulhas rings'. Agulhas rings are eddies of warm water that break off from the warm southward-flowing Agulhas Current and spin around the Horn of Africa into the South Atlantic. The rings bring warm, salty water from the Indian Ocean and make a contribution to the balance of heat and salt that controls the AMOC.
The "great ocean conveyor" is also known as the thermohaline circulation (THC) because vertical flow in the ocean is controlled by differences in temperature (~thermo) and salinity (~haline) that determine the density of sea water. - higher salinity and lower temperature makes water more dense. When salty surface water cools, it can become denser than the water in the deep ocean and sink. The THC is a theoretical concept, which cannot be measured directly. Instead we measure the meridional overturning circulation (MOC), based on poleward flow at the surface, and the equator-ward return flow at depth.
NOTE: This is a schematic representation of the global circulation of deep and surface currents, not a current map. Map of the main surface currents with names.
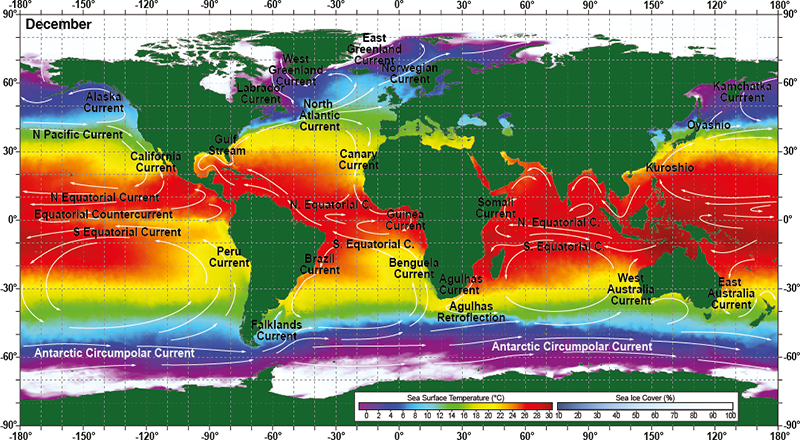
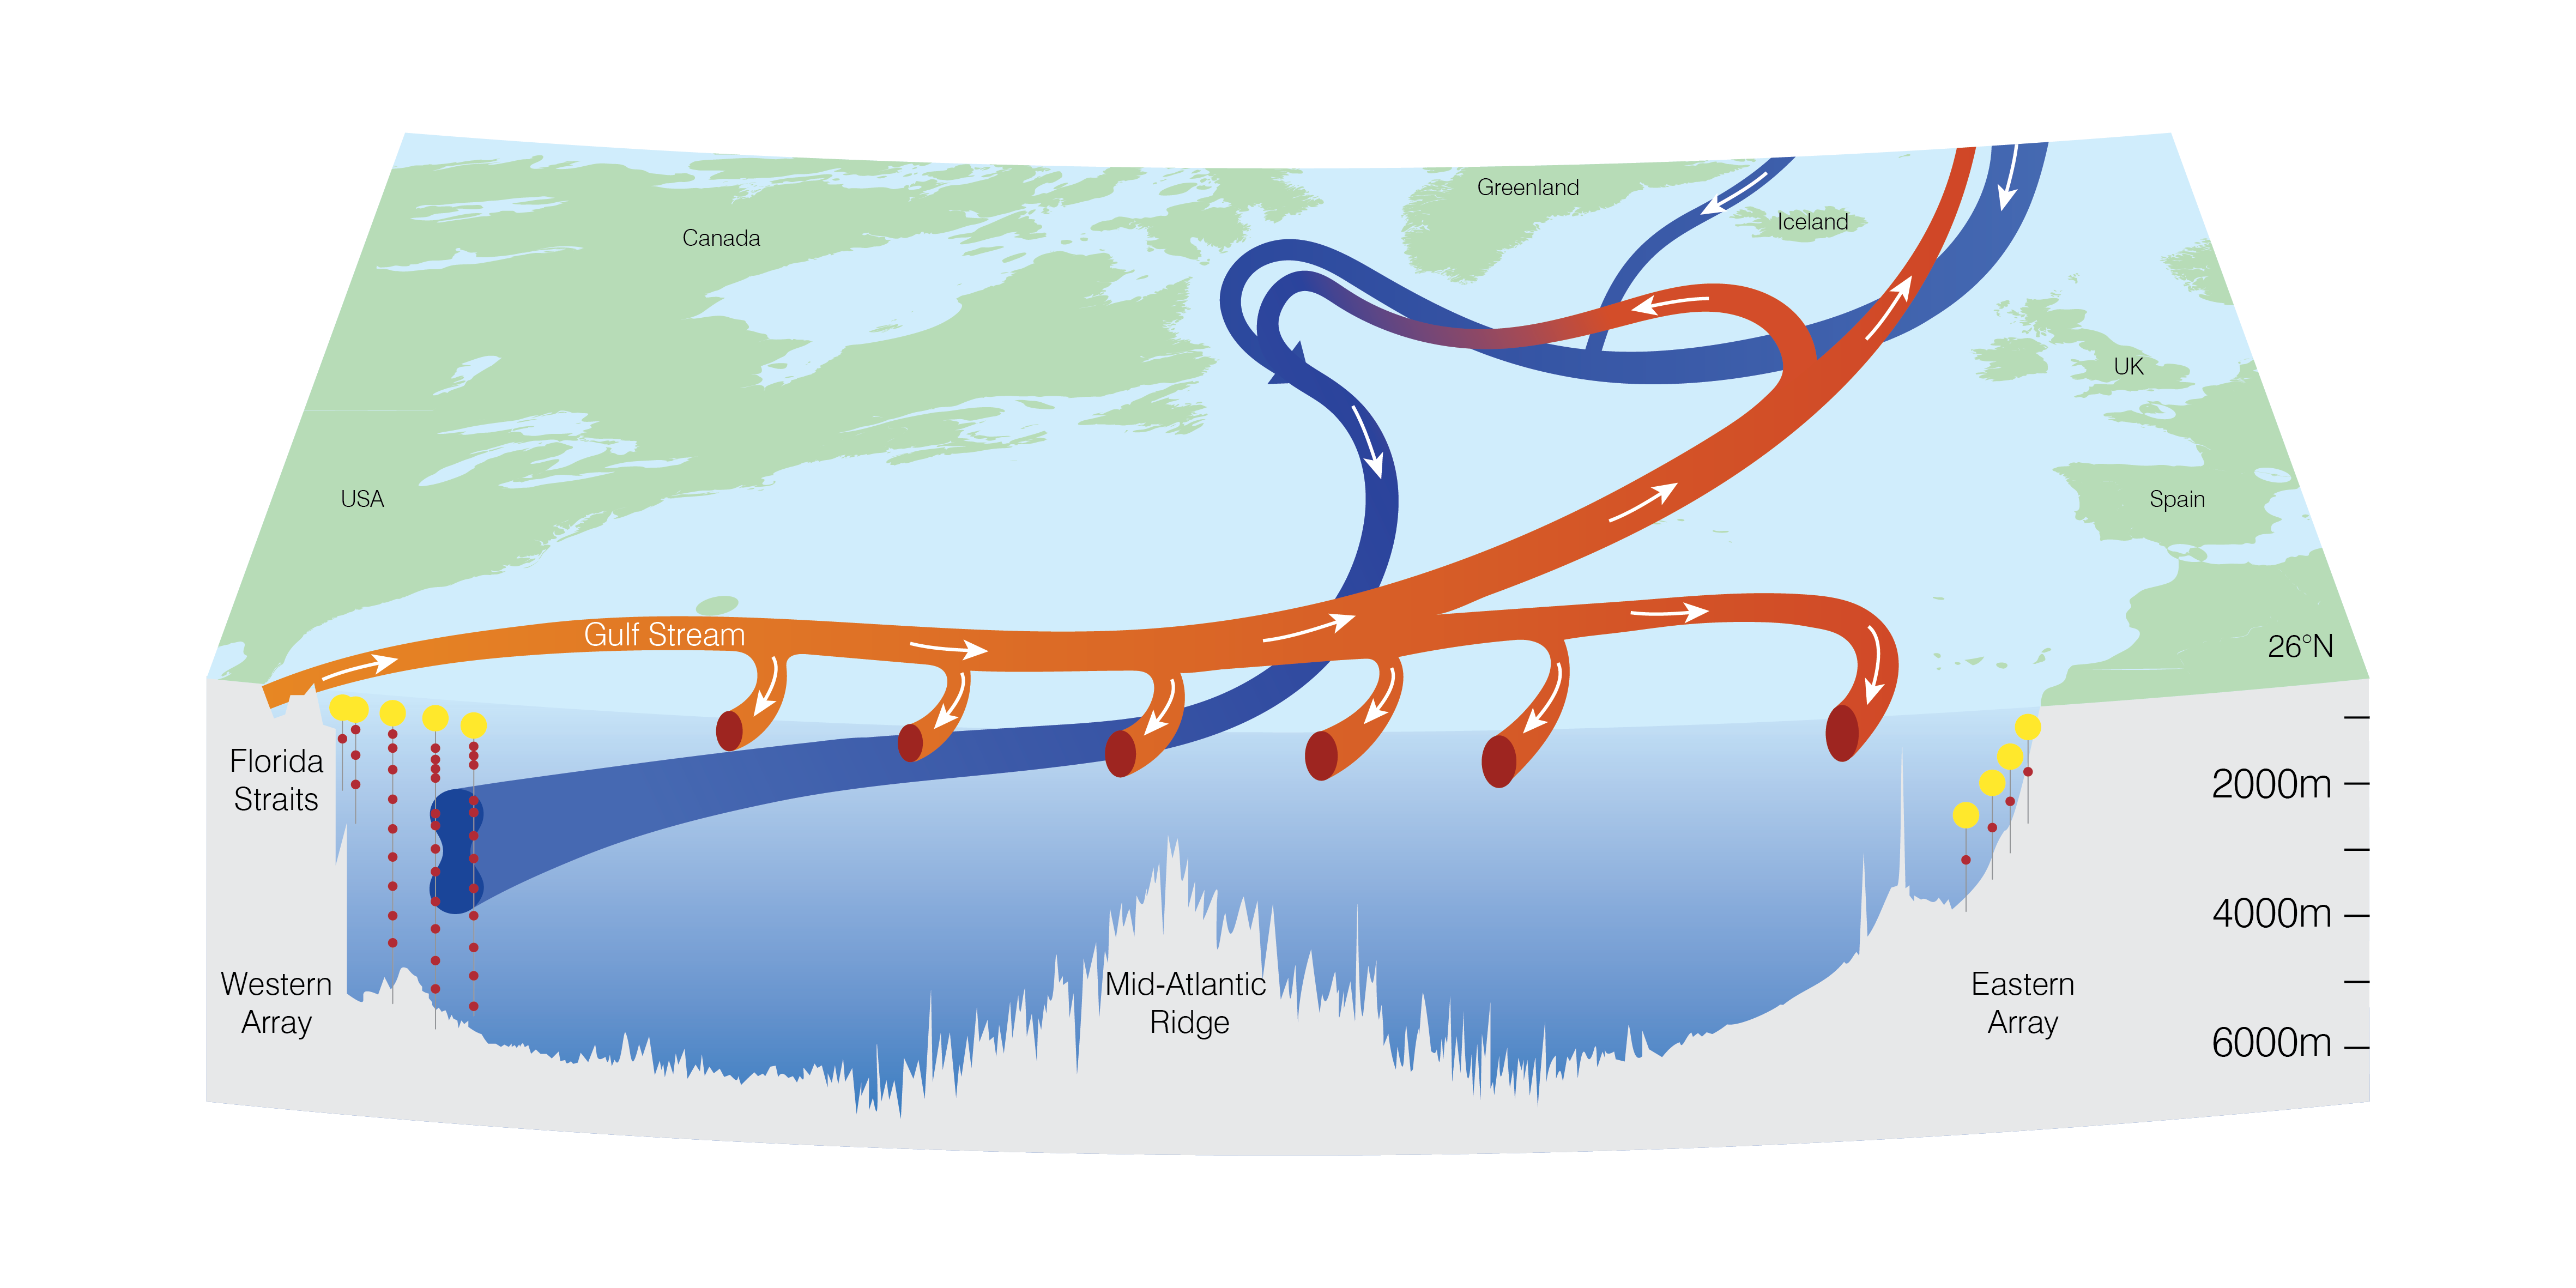
Figure 5. The North Atlantic overturning circulation with the location of the RAPID array moorings along 26°N. Modified from Church, 2007.
John A. Church (2007): A Change in Circulation? Science, 317 (5840), 908-909. doi:10.1126/science.1147796.
The RAPID array across the Atlantic at 26° North
The RAPID array consists of moorings that measure temperature and salinity continously from the sea floor to within a few metres of the surface. From this it is possible to calculate surface to bottom density profiles and use these to calculate transatlantic pressure gradients. From the pressure gradients we can derive southward / northward flow of water at different depth. For more information see Overview the 26° array. The moorings and the instruments used to make the measurements are described in figure 2 of the RAPID MOC field work report in 2004.
Northwards flow at the surface is mainly due to the Gulf Stream, which hugs the continental shelf of the eastern US. This is measured using the tall moorings on the Western boundary, which includes moorings deployed by the University of Miami with funding from the US AMOC programme. Flow in the the Florida Strait is monitored using submarine telephone cables; this work is carried out by the NOAA Atlantic Oceanographic and Meteorological Laboratory in Miami.
The monitoring of the AMOC at 26°N is thus a collaboration between RAPID and the US AMOC programme.
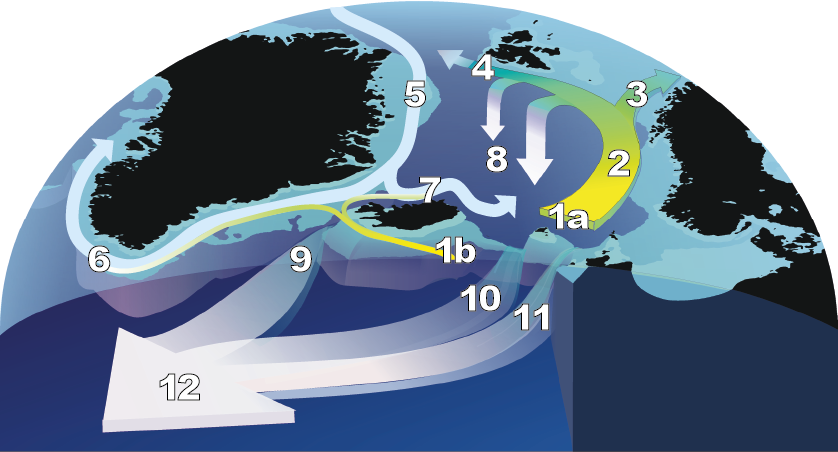
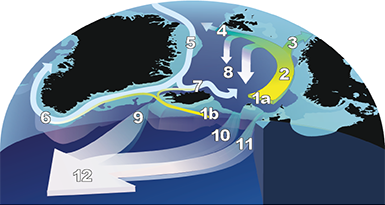
North Atlantic Deep Water Formation in the Nordic Seas Credit: NOC
North Atlantic Deep Water forms in the Nordic seas between Greenland, Iceland and Norway as warm, salty water from the Gulf stream system cools and sinks.
The North Atlantic Drift Current splits from the North Atlantic Current and carries Gulf Stream Water northwards to the South of Iceland (1b) and past Scotland into the Nordic Seas (1a).
The warm water continues north as the Norwegian Current (2), which splits into two as it reaches the Arctic. The North Cape Current (3) flows into the Barents Sea, warming the western regions of the Russian Arctic. The West Spitsbergen Current (4) flows into the Arctic Ocean through the Fram Strait between Greenland and Svalbard. and past Scotland into the Nordic Seas (1a).
Cold, polar surface water flows south through the Fram Strait in the East Greenland Current (5). This mixes with warmer Atlantic water, rounds the southern tip of Greenland and flows into the Labrador sea as the West Greenland Current (6).
In the central Nordic Seas the cold, fresh polar water, and the warm, salty Atlantic water mix. Heat from the Atlantic water is released to the air above. This mixing and cooling increases the density of the surface water, so it becomes dense enough to sink (8).
The Nordic Seas are separated from the main Atlantic basin by a shallow ridge from Greenland to Scotland. North Atlantic Deep Water flows across this ridge by three main routes: through the Denmark Strait (9), which is 600m deep and relatively wide; across the broad, shallow (3-500m) Shetland Faroe Ridge (10), and through narrow but deeper (1000m) Scotland Faroe Channel (11). The Nordic Overflows play an important role in the AMOC, which is not yet fully understood.
As it flows down the slope from the Greenland - Iceland - Scotland Ridge the Nordic overflow water mixes with Atlantic intermediate water to become North Atlantic Deep Water (NADW), which flows southwards at depths of 3-5000m - mostly along the western edge of the Atlantic Basin (12).
Collecting palaeoclimatology data
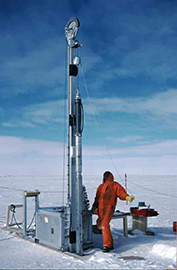
Top left: ice core drilling on Greenland. Photo: British Antarctic Survey,
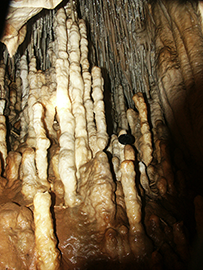
Top right: speleothems in Refugio Cave, Spain. Photo: Ian Fairchild.
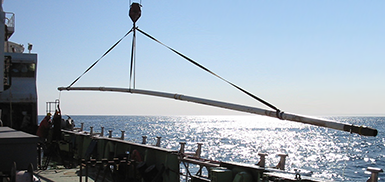
Bottom: collecting an 18m sea floor sediment core. Photo: Nick McCave.
Palaeoclimatology is the study of past climates. Modern records of temperature, rainfall, or wind speed only go back about 130 years, so to determine earlier climate patterns we need to use climate proxies - measurements of other parameters that can be related to temperature, rainfall or wind speeds in different parts of the world. The proxies are taken from ice cores, tree rings, fossils, cave deposits, corals, lake and ocean sediments, peat bogs etc.
In the first phase of RAPID several projects collected and analysed this type of data from the North Atlantic region, collected from Greenland ice cores, lake and ocean sediments, and caves.
Climate indicators from ice cores include oxygen isotope ratios, methane concentrations, dust etc. which were trapped as snow fell and later turned to ice. The depth of the ice is related to the time when the snow fell, but this is not always straightforward, since the amount of ice forming in a single year varies with temperature and rainfall.
Oxygen isotope ratios: The dominant oxygen isotope is 16O (8 protons and 8 neutrons), but there is also another isotope, 18O, (8 protons and 10 neutrons). The ratio of 16O to 18O in a chalk deposit, ice core or micro-fossil can be used to estimate past temperatures.
Caves contain mineral deposits left behind by ground water. Stalactites grow as water drips from the cave ceiling leaving pointed mineral deposits that hang down like icicles. Stalagmites are upward-growing, rounded mounds of mineral deposits that have precipitated from water dripping onto the cave floor. Both may have annual bands created as a result of seasonal changes in the ground-water flow. Oxygen isotope ratios from these layers may be related to temperature at the time the minerals were deposited.
Lake and ocean sediments contain microfossils of planktonic organisms from the past. The species composition of microfossils may be related to the temperature of the water at the time when the sediment was deposited. Oxygen isotopes data from these microfossils can also be related to past temperatures, or used to date the different sediment layers.
Sea floor sediments from high latitudes may also include gravel and sand that were carried south by icebergs calved from Arctic glaciers. The presence/absence of 'ice-rafted' deposits give an indication of how far south ice-floes could travel before they melted, and thus an indication of climate at the time they were deposited.
The 8200 year event
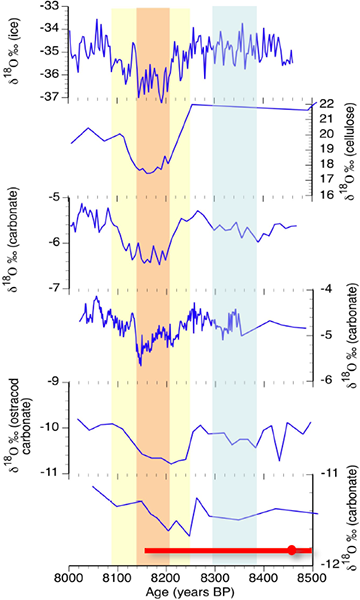
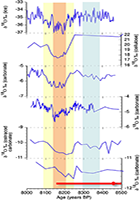
Figure 1. Oxygen isotope ratio from different study sites in Europe and eastern North America, compared in the RAPID ISOMAP UK project.
Credit: Jonathan Holmes, UCL.
To identify a record, select it in the figure.
Stable isotope signatures of water are preserved in a range of natural archives - directly in glaciers, ice sheets and fluid inclusions, or indirectly in minerals and organic material found in lake sediments, peat and speleothems. Isotope ratios record information about air temperature, changes in the hydrological cycle, prevailing winds and the rain-out history of air masses. This can be used to reconstruct past climates.
Stable isotope signatures of water:
Water molecules [H2O] consist of 1 oxygen atom and 2 hydrogen atoms.
The most common isotope of oxygen, 16O, has 8 protons and 8 neutrons, but an isotope with 8 protons and 10 neutrons,
18O, also exists. Water molecules with 18O are heavier and do not evaporate
as readily as water molecules with 16O, so seawater in regions with high evaporation is enriched in
18O while rain and snow have higher 16O.
The dominant form of hydrogen has 1 proton. Deuterium, 2H or D, has 1 proton and 1 neutron, giving it twice the mass
of ordinary hydrogen. Water that contains deuterium rather than hydrogen is known as "heavy water".
At mid- to high latitudes there is a close relationship between air temperature and the isotope composition of rain and snow. But isotope ratios are rarely simple palaeo-thermometers or palaeo-rain gauges. Instead they reflect variability in the hydrological system, including isotope ratios at the sea surface, seasonal rainfall patterns, and prevailing patterns of atmospheric circulation and condensation temperature of precipitation. Modelling studies can help to disentangle these effects and relate the isotope records to past climate patterns.
Figure 1 shows isotope ratios for oxygen (δ18O) from different sites in eastern North America and Europe. All these show a marked change about 8200 years ago. The most likely cause is a sudden flow of glacial melt-water from Lake Agassiz into Hudson Bay (figure 2), and from there into the Labrador Sea and North Atlantic.
Lake Agassiz formed to the south of the shrinking Laurentide ice sheet about 11,700 years ago, dammed to the south by land and to the north by the ice sheet. When the ice-dam failed around 8,200 years ago, the catastrophic outflow of meltwater - some 5 Sv over half a year - was sufficient to severely disrupt the AMOC and its poleward heat transport.
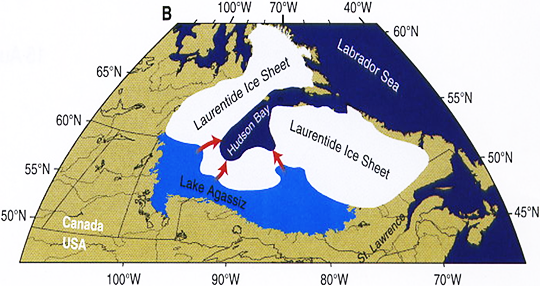
Figure 2. Lake Agassiz and meltwater routes (red arrows) trough the Laurentide ice sheet into Hudson Bay.
Credit. J. Holmes, UCL.
Evidence of the event can be seen in Greenland ice cores as a ~ 200 yr cold period during which temperatures dropped by an estimated 4 to 8 °C. It is also present in isotope records from many other locations. The change lasted around 150-180 years, and was most likely in response to a complex pattern of melt-water discharge sufficient to weaken the AMOC dramatically.
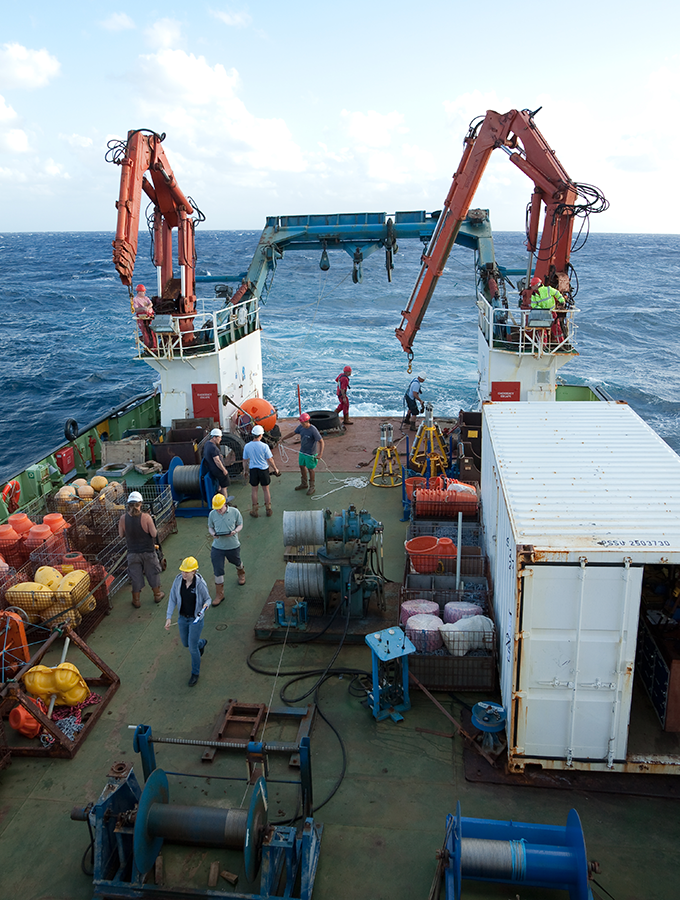
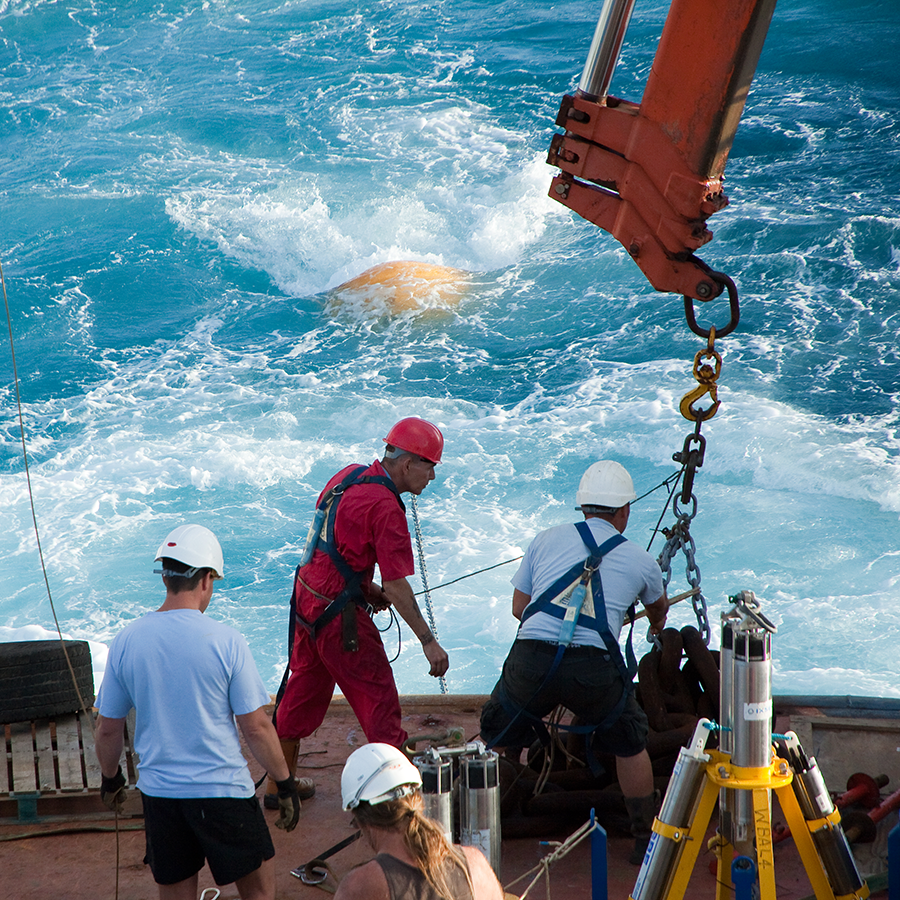
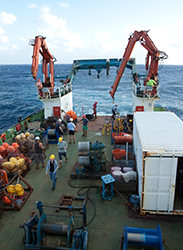
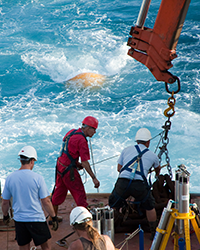
Aft deck of RRS Discovery during the recovery and replacement of RAPID moorings in spring 2014.
Photo: Ben Moat, NOC.