


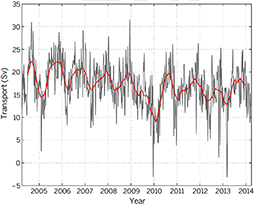
AMOC time-series 2004-2014. MORE
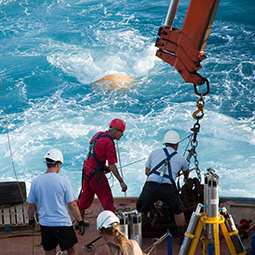
Photo: Ben Moat Larger
Can you predict the AMOC?
The Atlantic Meridional Overturning Circulation (AMOC) transports heat northwards in the Atlantic, and gives Western Europe its moderate climate. Without it, our winters would be colder than they are.
In April 2014 the RAPID measurements of the AMOC at 26°N reached 10 years of continuous observations. This autumn the RAPID team will retrieve instruments that have been deployed in the Atlantic since April 2014, and another 18 months of AMOC data will soon be available.
The challenge: can you predict what the new data will show?
Submit your AMOC estimates before 31st December for a chance to win a Discovery mug.
How to take part
Learn more about the AMOC and the RAPID observations
Learn more about the AMOC and the RAPID observations
If you are new to AMOC science learn more by reading our Science Background. For the most important research findings based on the ten years of RAPID observations are summarised in A decade of RAPID observations yields a few surprises. You may also want to look at the 10 years or RAPID blog, which followed the last RAPID research cruise and the data analysis that completed the 10-year time series.
Download and study the data
For easy access we have collected the AMOC observations for the last 10 years into a data file that can be opened in Excel or another spreadsheet. Download and study the data to see how the AMOC varies with time.
Follow the RAPID Challenge blog
Nobody knows exactly what the AMOC has been doing for the past 18 months. Not until the new observations have been collected and analysed. The RAPID Challenge blog tells you what some of the experts predict. It will also follow the RAPID team on RRS Discovery as they recover the moorings in the RAPID array and analyse the data to see what the AMOC has been up to.
Submit your own AMOC estimates
The AMOC has an approximate seasonal cycle. Use your understanding of what has happened so far to estimate what the average flow of the AMOC has been for six 3-month periods between April 2014 and September 2015. Nobody will know this exactly until the new data is released.
Once you have made your estimate, you can submit it on AMOC submission form on the RAPID website. We want 6 figures in total, one for each quarter. Each person is allowed one estimate. If you change your mind and think you have a better prediction, simply submit your new estimate; we will ignore the older one when comparing the estimates to the actual data.
Wait for the new AMOC data to be revealed
A preliminary analysis of the 18 months of new data will be added to the AMOC time-series in early January 2016. We will then compare the submitted estimates to the data, and announce the best predictions. The winners will be awarded a Discovery mug, and have the opportunity to publish their estimates on the RAPID website, along with their explanation of how they arrived at their results.
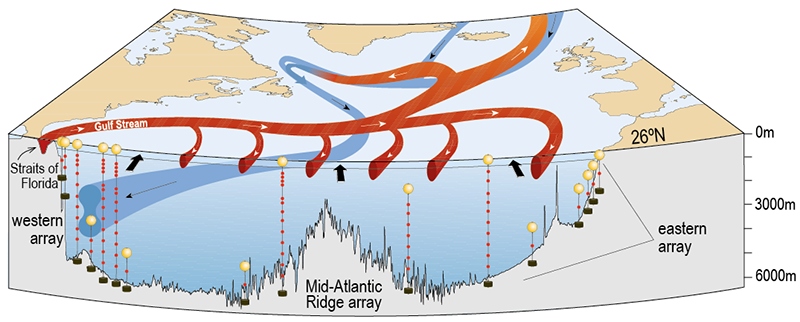
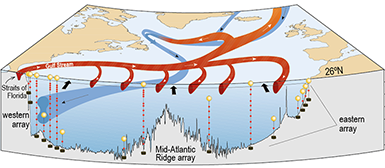
Schematic of the Atlantic meridional overturning circulation with the RAPID moorings. Credit: NOC
The RAPID array at 26° North
The RAPID array consists of:
- the Western Boundary array: several moorings running down the continental slope off the coast of Florida
- the Mid-Atlantic Ridge array: moorings on the east and west side of the Mid-Atlantic Ridge, and
- the Eastern Boundary array: several shorter moorings running down the continental slope of the coast of Morocco.
- Cable measurements in the Florida Channel complement the moorings, and complete the measurements needed to calculate the AMOC and its components.
The moorings measure temperature, salininity and ocean currents at several depths. The tallest mooring is over 5km high.
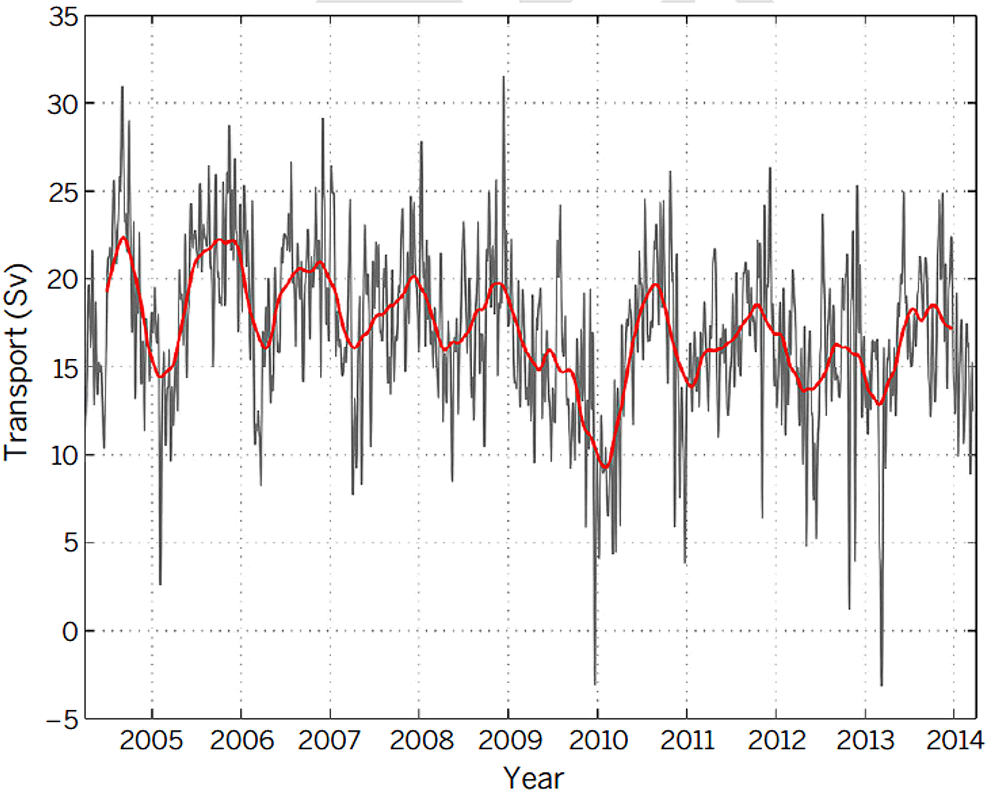
10-year time series of the AMOC measured at 26.5°N from April 2004 to March 2014. The gray line represents the 10-day filtered measurements, and the red line is the 180-day filtered time series. The seasonal cycle, the extreme decline in the AMOC during 2009-2010, and the overall decrease in strength over the 10 years are all clearly visible.